

BRITISH ACCENT DOESN'T MAKE IT CORRECT
BRITISH ACCENT DOESN'T MAKE IT CORRECT

I like to watch videos by Mallen Baker and Tony Heller to see independent views of many subjects. I like Baker’s British accent but often disagree with his liberal bias on many subjects. Now Heller, he tells it like it is, very much along the lines of Alex Berenson. But I recognize these are superior intellects compared to my own limited mind processes. However, in a recent discussion on (ugh) climate change, Baker produced the following chart.
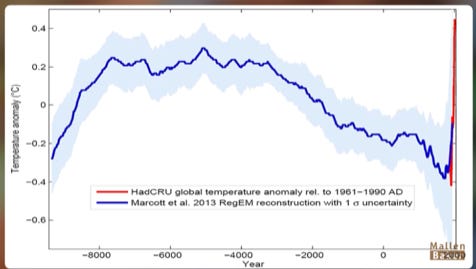
I don’t know why Baker did this. It is extremely misleading and is not actually data. It is a reconstruction. I know this because I published Andy May’s book, CLIMATE CATASTROPHE: Science or Science Fiction? Here is what Andy May [another superior intellect] had to say about this chart in Chapter 4.
Examining the Marcott, et al. proxies
“The Marcott, et al. global reconstruction (see Figure 34) used many proxies that did not cover the entire period being reconstructed, thus as proxies come and go “proxy dropout” causes anomalies, such as the very noticeable spike at the end of the reconstruction, which is due to one point at 1940. Although Marcott, et al. had a total of 73 temperature proxies, only 25 of them had values within 50 years of 1940 AD, and those values average 0.06°C, considerably different from what we see in
Figure 34.
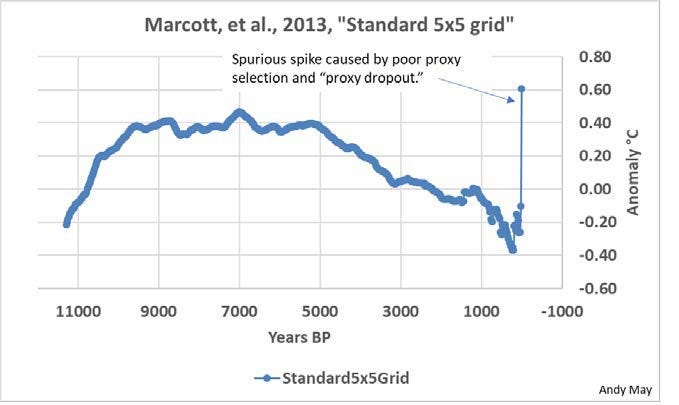
Figure 34. Marcott Holocene temperature reconstruction, data source Marcott, et al., 2013 supplementary material.
The spike is not real, is not in the underlying data, and should never have been included in the results or paper. The spike is due to proxy drop out, proxy inconsistencies and the authors changing some published dates in the proxies, according to Steve McIntyre at climateaudit.org (S. McIntyre 2013) (S. McIntyre 2013b) (S. McIntyre 2013c) and (Foster 2013) (“The Tick”). Even Marcott has acknowledged that his reconstruction from 1890 AD onward is not robust.”
The following quote is by Marcott and colleagues (S. A. Marcott, J. D. Shakun, et al. 2013b):
“We showed that no temperature variability is preserved in our reconstruction at cycles shorter than 300 years, 50 percent is preserved at 1000-year time scales, and nearly all is preserved at 2000-year periods and longer. Our Monte-Carlo analysis accounts for these sources of uncertainty to yield a robust (albeit smoothed) global record. Any small “upticks” or “downticks” in temperature that last less than several hundred years in our compilation of paleoclimate data are probably not robust, as stated in the paper."
“That being the case, the tick at the end should never have been in the paper.”
—Andy May
Get it Mallen?